- The Hidden Layer
- Posts
- How to Make Data Analyzing (a bit more) Fun
How to Make Data Analyzing (a bit more) Fun
Lessons From my Science Fair Project, Part 10
Brandon Kim
December 14, 2025
What was discussed last (last) week…
Vibe-coding can be best defined as the “using of NLP models (a type of AI) to generate working code, thus making programming more accessible, especially for beginners”.
Vibe-coding, in short, does work! (up to a certain point…)
In explanations and papers, AI models that deal with images and 3D files use a (C, D, H, W) notation to refer to the “shape” of a given file’s data that’s being processed.
Due to the nature of my science fair project (training AI models), one of the most crucial aspects of developing a working, functional, and robust model is ensuring that you give good-quality data to the model. Thus, many people in the data science and AI industry stay by the mantra, “garbage in, garbage out” (GIGO), and associate it with the data cleaning step, also known as data “preprocessing” in creating an AI model.
But analyzing data is just numbers and letters, isn’t it? How do you make it more fun?
With graphs and tables, of course!
Thurs >> December 11
I decided on using primarily three file formats for data collection, storage, and visualization:
These file formats are often used in sorting metadata about datasets that are used in well-known AI datasets such as CIFAR-10 and the Iris Species datasets.
What is metadata? It’s essentially data about the dataset (hence the “meta”), which is important in assessing if the dataset has high- or low-quality data, as well as assessing how varied your dataset is in terms of certain metrics shown in the metadata (certain spacings, lengths of certain parts, demographic data, income, etc). Here’s an example of metadata from the Iris Species dataset:

This metadata uses the .csv format.
Fri >> December 12
Today, I tried making a graph, specifically a histogram, about the different file sizes of the dataset that I was using in my project:

This kind of distribution is called a “skewed-right” distribution, due to the “trailing” or “skewing” of the data towards the right side of the graphs.
I did this by using matplotlib, a Python library, which enables Python programs to display data in a colorful manner.
Sat >> December 13
Turns out, all of this data analysis ended up in getting me some extra data from more publicly-available datasets! By that, I meant that I had filtered out data too harshly from a certain dataset that I shouldn’t have filtered or “preprocessed” so strictly.
After analyzing the combined dataset that I made, I realized that I had judged one particular dataset (I’ll call it “Dataset X”) too harshly in terms of how “high quality” it was based on one metric, the Z-spacing, or the space between the heights between 3D pixels (aka voxels). The more smaller the Z-spacing is, most likely, the higher quality the 3D data is, because the data will be more detailed and “dense”.
What happened was I only admitted files from Dataset X that had a Z-spacing that was under 0.625mm, which according to the files that I already had in my dataset, I realized that that threshold/standard was way too strict.
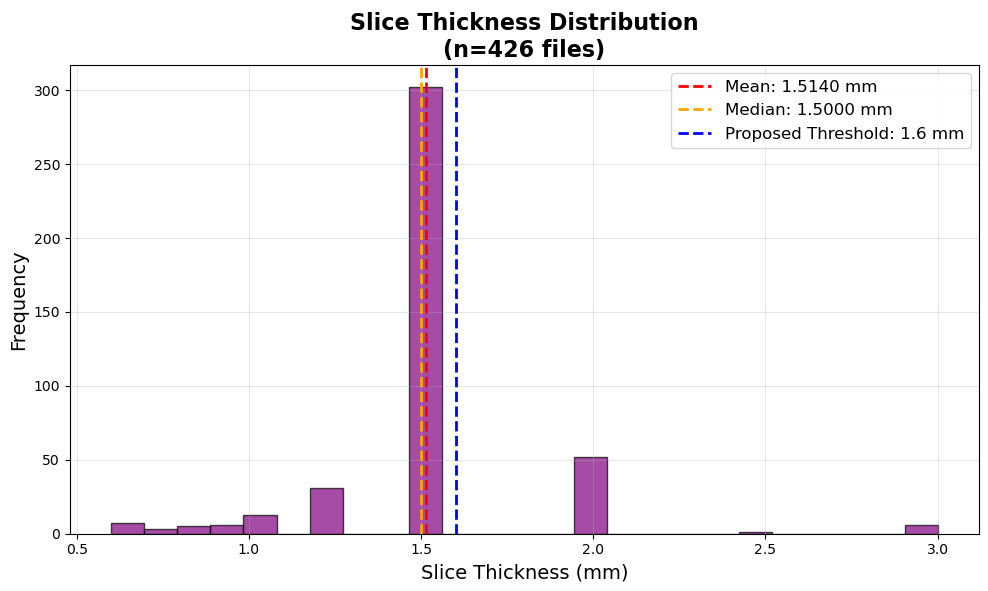
This graph is for the data that I already had in my dataset before accepting Dataset X. This new threshold maintained the lowest Z-spacing (and thus higher quality), while also including the majority of the data that was already in my dataset.
So, I adjusted the metric to 1.6mm instead, which is right above the average, so that most of the files that I already had in my dataset can stay for their “good enough quality”.
After adjusting this new threshold for the Z-spacing, I deleted all the files that had a Z-spacing above 1.6mm, and added the Dataset X’s data into mine, and so the distribution of Z-spacing changed for my dataset:

This graph is for the data that I already had in my dataset before accepting Dataset X, and as you can see, now all of the files’ Z-spacings fall below the 1.6mm threshold.
Lessons Learned
“Metadata” refers to the data about data (for a given dataset), and helps assess the data’s quality and credibility.
There are a variety of file formats for the raw data itself, but for looking at metadata, the main file formats for that are CSV, Excel, and JSON.
Analyzing the data that you already have for QC (quality control) is not just a good idea, but necessary when it comes to training AI models.