- The Hidden Layer
- Posts
- "Marching" Into a New Year
"Marching" Into a New Year
Lessons From my Science Fair Project, Part 11
Brandon Kim
December 28, 2025
What was discussed last last week…
“Metadata” refers to the data about data (for a given dataset), and helps assess the data’s quality and credibility.
There are a variety of file formats for the raw data itself, but for looking at metadata, the main file formats for that are CSV, Excel, and JSON.
Analyzing the data that you already have for QC (quality control) is not just a good idea, but necessary when it comes to training AI models.
!! Linear Algebra Alert !!
This week’s topic will primarily be covering the Marching Cubes Algorithm, a topic in data science that heavily relies on linear algebra, so this week’s newsletter may be more cryptic than usual.
Also, this newsletter covers two weeks, as it took me a while to fully understand this concept of “Marching Cubes”.
Thus, this newsletter will be the last that I’ll post before the New Year!
Fri >> December 19
For context, my science fair project primarily works with 3D data (aka volumetric data), and in short, I created an AI model that “sections off” what 3D pixels (aka voxels) are considered to be “within an object” or not. This process is called segmentation, and it’s akin to drawing the outline of, say, a stop sign or any other object that’s in a larger image.
But enough about that. I didn’t work much on my AI 3D segmentation model this week, and instead worked on an algorithm that turns my segmentations into actual objects that can be visualized.
What do I mean by this? Well, given a set of 3D voxels, it will just look like a scatter plot, where every voxel looks like a star in the night sky, or like Minecraft, where every voxel represents a solid block, with no curves or edges to it at all, and the visualization of the raw segmentation file will look very pixelated.
You know what would look nicer? A 3D model that looks like an actual shape, compared to just a bunch of dots, so we need to “connect all the dots” (the dots are voxels) in order to make a bunch of small triangles from the dots: this task is done through the Marching Cubes algorithm.

Left: The input, which is 3D data with just simple voxels.
Right: The output, which is the 3D data converted into shapes (i.e. triangles) that can be exported as an object file.
This algorithm is used in many different fields, for instance: medical imaging for reconstructing CT and MRI scans, geology for modeling underground ore bodies and rock layers, and computer graphics for generating procedural terrains and fluid simulations.
Fri >> December 26
When implementing the Marching Cubes algorithm to reconstruct my 3D-CT scan-segmentation data, I spent many hours learning the conceptual understanding of how Marching Cubes worked in order to implement it correctly.
Let’s start with the input for the algorithm: a 3D file made up of voxels, which, again, look like a Minecraft map with its blocky-ness and no curves or smoothness whatsoever.
When representing all the voxels in the input as single points, the first step in the Marching Cubes algorithm is to “divide” the whole data into small cubes by creating straight lines that go through all the 3D voxel points both horizontally and vertically to make kind of a 3D plane/space that encompasses the whole data. This would make each 3D voxel a “corner” of a cube.
Then, the second step would be to identify which data points are inside the segmented region or outside the region. For example in a geological context, all the 3D voxels that are within, say, a oil vein would be considered to be “positive” voxels, while all the other voxels would be “negative”.
Since we now know that somewhere on each edge between an inside pixel/voxel corner and an outside pixel/voxel corner, the original surface must intersect the squares/cubes, for the third step, we can put dots on their midpoints between the inside pixel/voxel corner and the outside pixel/voxel corner.
Lastly, for the fourth step, connect the dots to separate the inside and outside corners and get the reconstructed shape!
This is what the Marching Cubes process would look like, but since it will take forever to render a 3D model with all of the annotated inside and outside voxel corners, here’s a festive example using the same idea but with a 2D model (aka “Marching Squares”):

I colored the dots in festive colors also!
Clarification:
“Positive” and “Inside” are the same thing when describing pixels/voxels, and so are “Negative” and “Outside”.
Considering the Marching Cubes Algorithm in a 3D space, however, separating the inside voxel corners and outside voxel corners will require using 2D shapes (instead of a simple, 1D line) to be applied repeatedly around the whole 3D shape. For this, the Marching Cubes Algorithm sets these rules in order to accomplish this task:
Only triangles will repeatedly be used to make up the multiple sides of the 3D shape that will separate inside voxels from outside voxels.
Only points along edges (lines/axises between voxels) can be triangles’ corners.
So starting with a simple example of only one positive voxel and seven negative voxels (or the swapped version with seven positive and on negative):

Only one voxel corner is separated from the other seven voxel corners.
Moving on to more complicated configurations, the way the Marching Cubes Algorithm determines what edge points to use as triangle corners goes as follows: if an edge is between two inside voxel corners, then that edge’s points can’t be used as triangle corners. However, if an edge connects an inside voxel corner to an outside voxel corner, then that edge’s points WILL be used as triangle corner.

Voxel corners with the blue square are inside voxel corners in this visualization.
Points along edges with an X can’t have triangle corners, but points along edges with an O can.
Additionally, here is an example of what three inside voxels on the bottom half of the cube would look like:

Now, three voxel corners are separated from the rest of the five voxel corners.
In fact, there are about 2×2×2×2×2×2×2×2 (256) different type of triangle combinations that could be applied to all the different kinds of inside/positive and outside/negative voxel combinations within a cube with 8 corner voxels. Thus, calculating what each marching cube should look like manually every time would be very tedious and time-consuming, which is why we have lookup tables! Lookup tables are basically a “dictionary” that the Marching Cubes algorithm will use to correspond a given cube to a given configuration of triangles based on their inside and outside voxel corners. They also dictate which “style” of triangle configurations to use for every cube, because for some cases, a marching cube could have more than one valid configuration of triangles:

So, to make this process simpler, researchers have found that there are only 15 unique combinations of triangles to cover all the 256 cases (considering all the rotations and reflections), so lookup tables have a general formula to follow when listing all the 256 possible marching cube configurations.
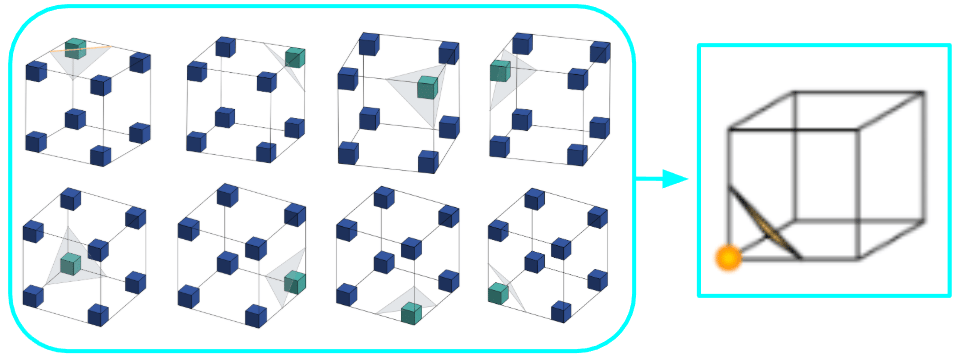
All these 8 configurations (technically 16 because the inside and the outside voxel corners can be swapped) can be described by this one unique combination.

These combinations also exhibit the Marching Cubes rule that all the 2D shapes that make up the border between the inside/positive voxels and the outside/negative voxels are only triangles, whether they stand alone or combine with other triangles to make a more complex 2D shape.
After applying this algorithm across all the marching cubes across the whole 3D voxel plane, (hopefully) you can get a 3D object that looks much better than a blocky object!
Note that this was a very basic overview of how the Marching Cubes Algorithm works, but hopefully you can see how useful it can be within different fields, including the CT scans that my AI science fair project works with.
Lessons Learned
The Marching Cubes Algorithm is used when 3D data needs to be converted or “reconstructed” into a object file form, and the concepts it uses are fond in linear algebra.
It’s also hard to explain without using 3D models, lol.